InsightSQC — affordable, accurate SQC.
We recognize the importance of precision and accuracy in the fuels and biofuels industry. That's why we developed InsightSQC: a state-of-the-art tool designed to deliver affordable, high-quality, user-friendly quality control analytics and charting for your operations.
SQC that lab analysts actually use.
InsightSQC produces the control charts, moving-range plots, and trend analyses your QC program needs — without the complexity (or cost) of generic statistical software.
Configure once, then let the data flow in. Out-of-control conditions are surfaced immediately, with the context you need to investigate.
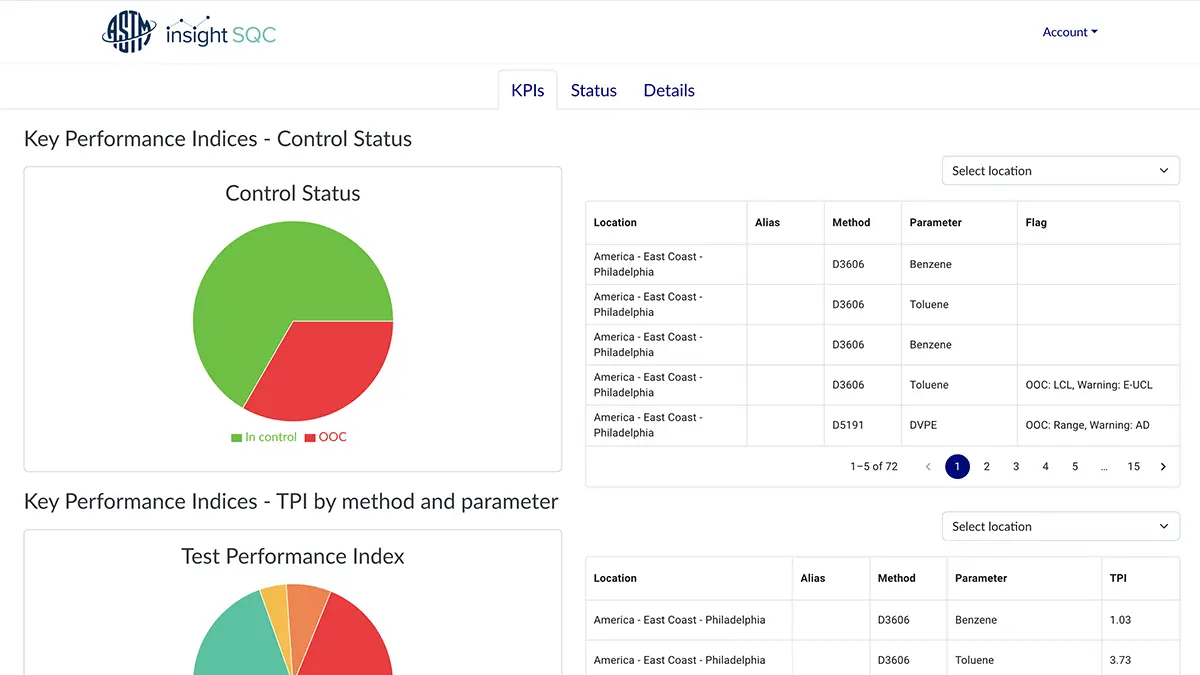
Charts & analytics
Control charts
I-charts, MR charts, EWMA, and more — the standards your auditors expect.
Configurable rules
Western Electric, Nelson, or your own house rules for out-of-control detection.
Trends & calculations
Built-in computations with full traceability back to the source data.
Exports
Push charts and tables to compliance reports without re-keying.
Ready to talk?
Reach out for a demo, pricing, or a deeper conversation about how SRP fits into your lab's workflow.